

Year One Reflections
From sitting in Matt's living room recording with a broken microphone in February, to building Backtest into a podcast with thousands of listeners by December
We started Backtest for two reasons.
First, we wanted to spend more time diving into the defining moments in market history—deconstructing what happened, how it worked, and why it mattered.
We are constantly reading, but we wanted to add structure and rigor to our approach.
We wanted to supercharge our learning.
Second, we suspected other founders, investors, and operators wanted the same thing. For years, we’ve tuned into shows like Founders, Invest like the Best, Acquired, The Rest Is History, and Dan Carlin’s Hardcore History.
We realized that a podcast could be a great way to channel our energy and curiosity. What’s more, we realized that even though we had a go-to podcast to “learn from history’s greatest entrepreneurs” (Founders) and a go-to podcast to “learn the playbooks that built the world’s greatest companies” (Acquired), we didn’t have a go-to podcast to learn the lessons from market history.
So we decided to build it.
As we look back on our first year, we are happy that we found a topic valued by so many of you. We shipped a total of 13 episodes, each backed by hundreds of hours of research.
We are proud of how far we’ve come, expanding our understanding, not just of market history, but of how to tell compelling stories.
Most of all, we are grateful for all the people who helped us this year by giving us honest feedback about the name, the format, the stories, and the research.1
We couldn’t end the year without reflecting on lessons we learned and how they may inform our understanding of markets in 2026.
The stock market bubble narrative
Today’s booming stock market driven by AI might sound a lot like the dot com bubble of the 1990s.
And yet, despite high valuations, stocks right now are not as expensive as they were in early 2000—especially once you compare cyclically-adjusted earnings yields to interest rates.2
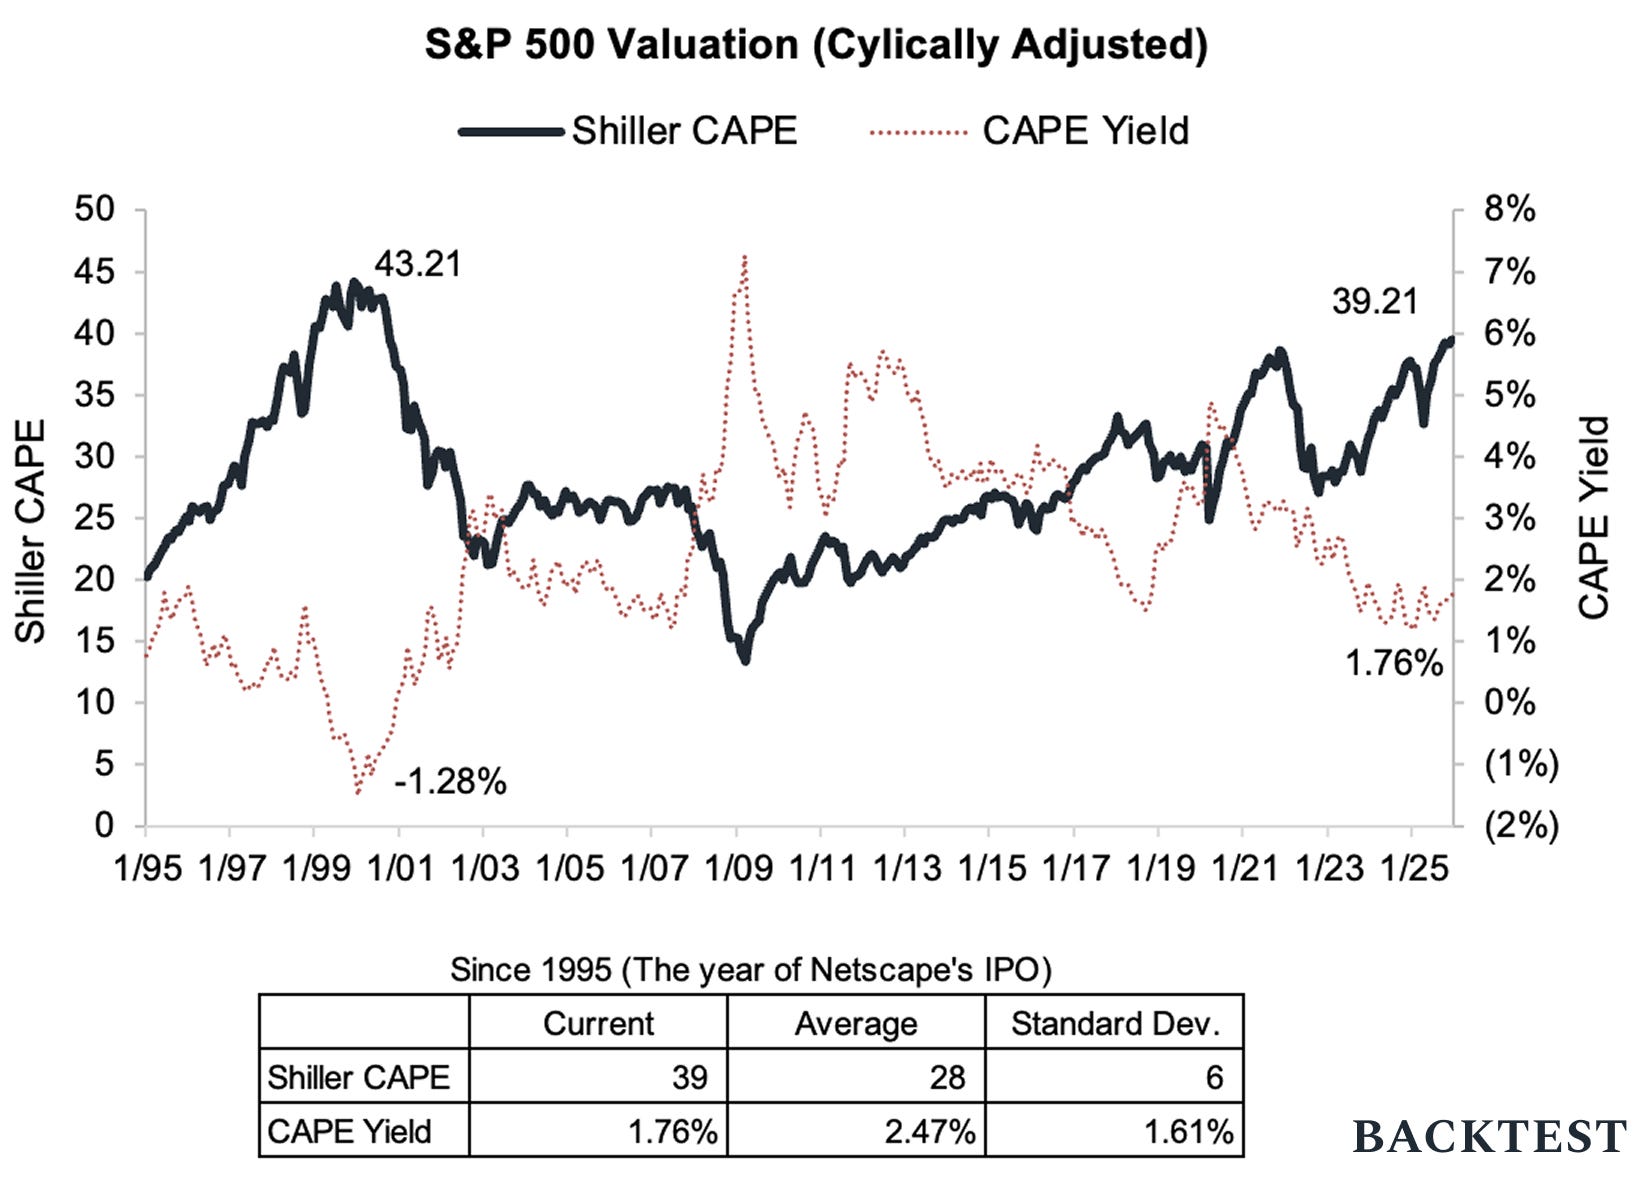
During the dot com bubble, the Nasdaq price-to-earnings multiple (PE) reached 150x. Today it trades around 32x and the average since 2003 has been 23x. So valuations are certainly above the historical average, and we should keep a watchful eye on stock prices, but a major market crash from extreme valuations is not a foregone conclusion.
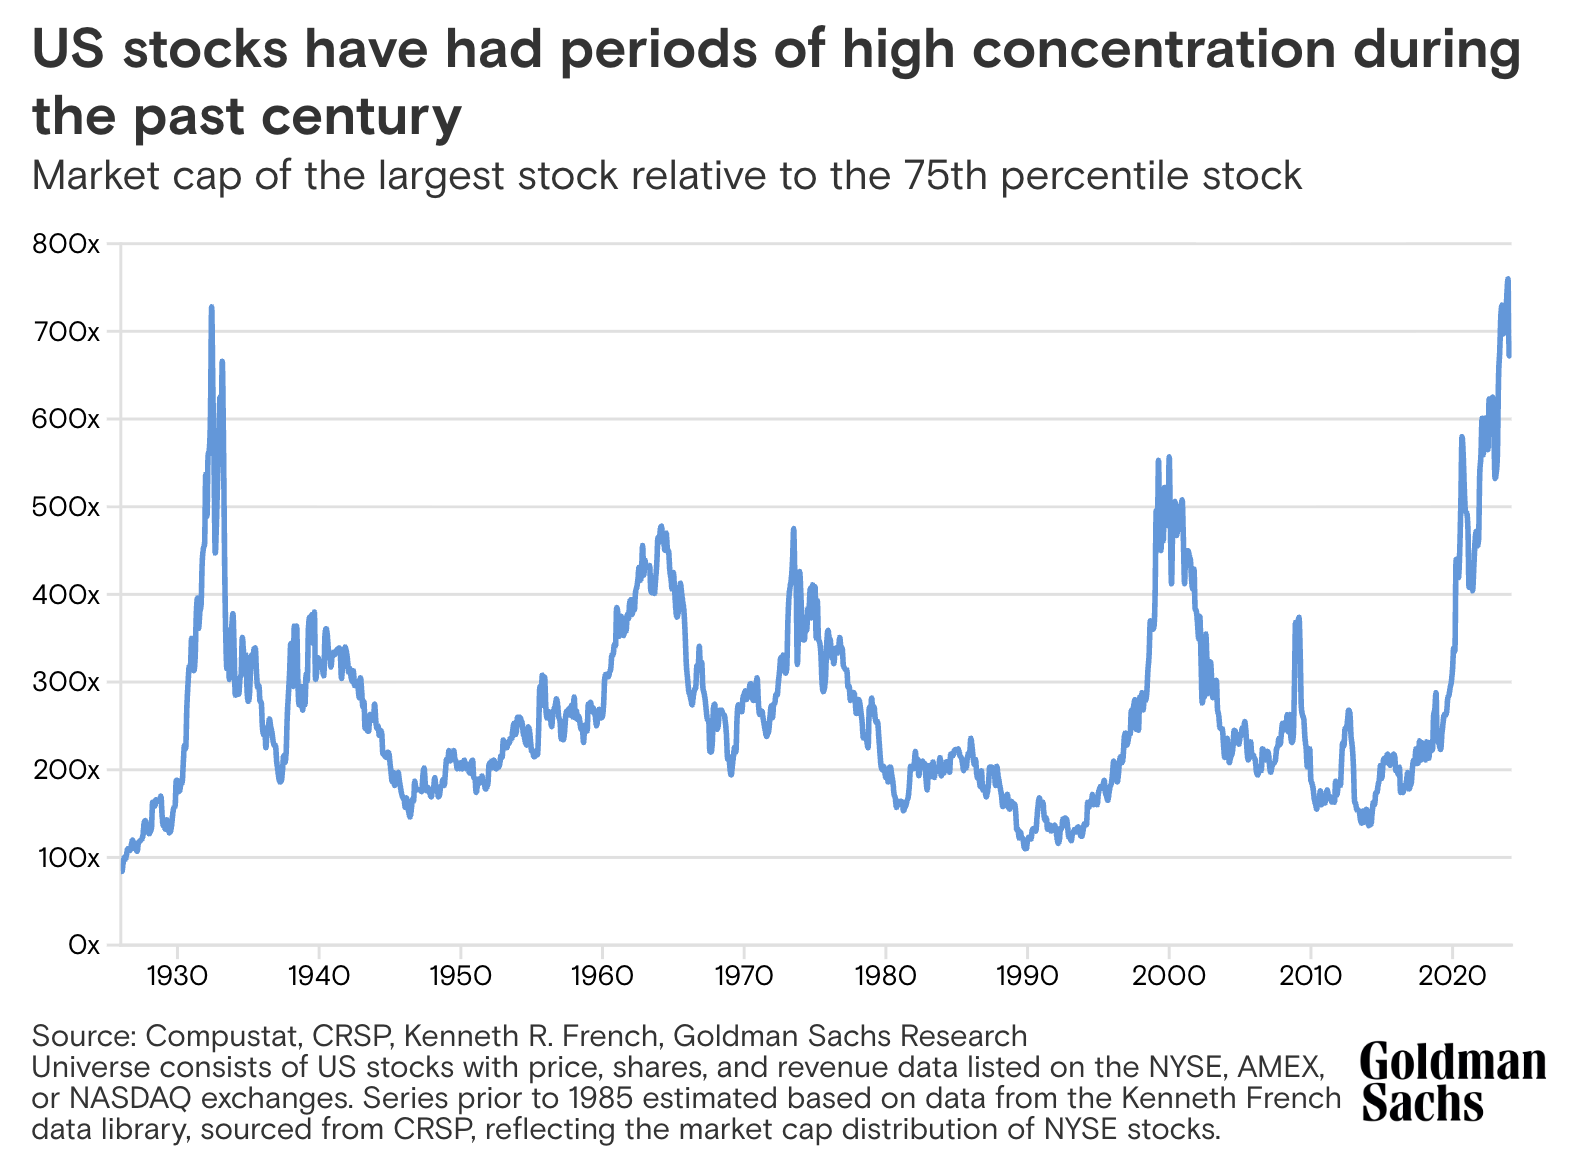
But it’s worth noting the level of concentration in the market. In contrast to the early 2000 period when the top 5 companies represented a little less than 20% of the S&P 500’s market cap, today’s top 5 companies represent closer to 30%.
The capital investment trends
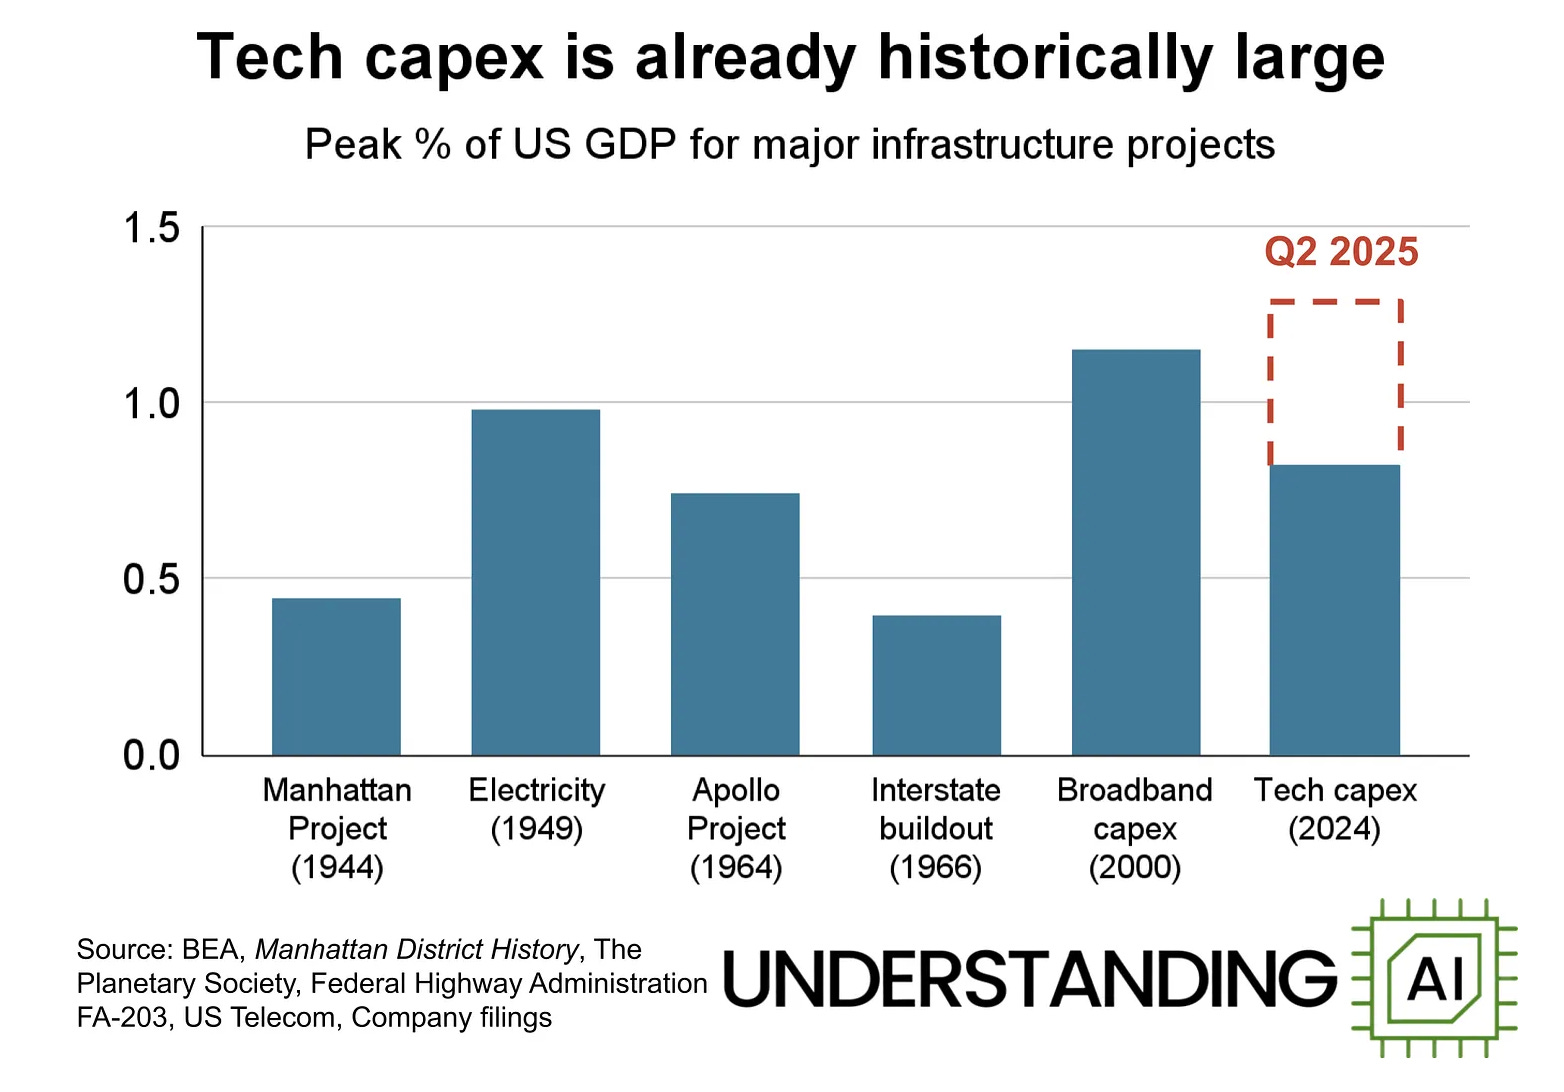
One of the most noteworthy trends this cycle is the magnitude of capital being deployed on AI infrastructure. Capex is an important signal of future growth, cash flow, and productivity. It lights the way on where the economy, and underlying markets, are trending.
In the Shale Revolution series we touched on the natural gas pipeline build out in the 50s and 60s. We concluded that it was one of the most attractive investment opportunities at the time.3
We also talked about the massive amounts of capital invested in drilling activities during the 2000s, and how the returns failed to materialize after oil and natural gas prices crashed from oversupply.
In Part 2 of the Dot Com Boom series we talked about the capital deployed to build out fiber networks for the internet. This capital also failed to generate a financial return for investors despite laying down the infrastructure that allowed the internet to thrive for decades after.
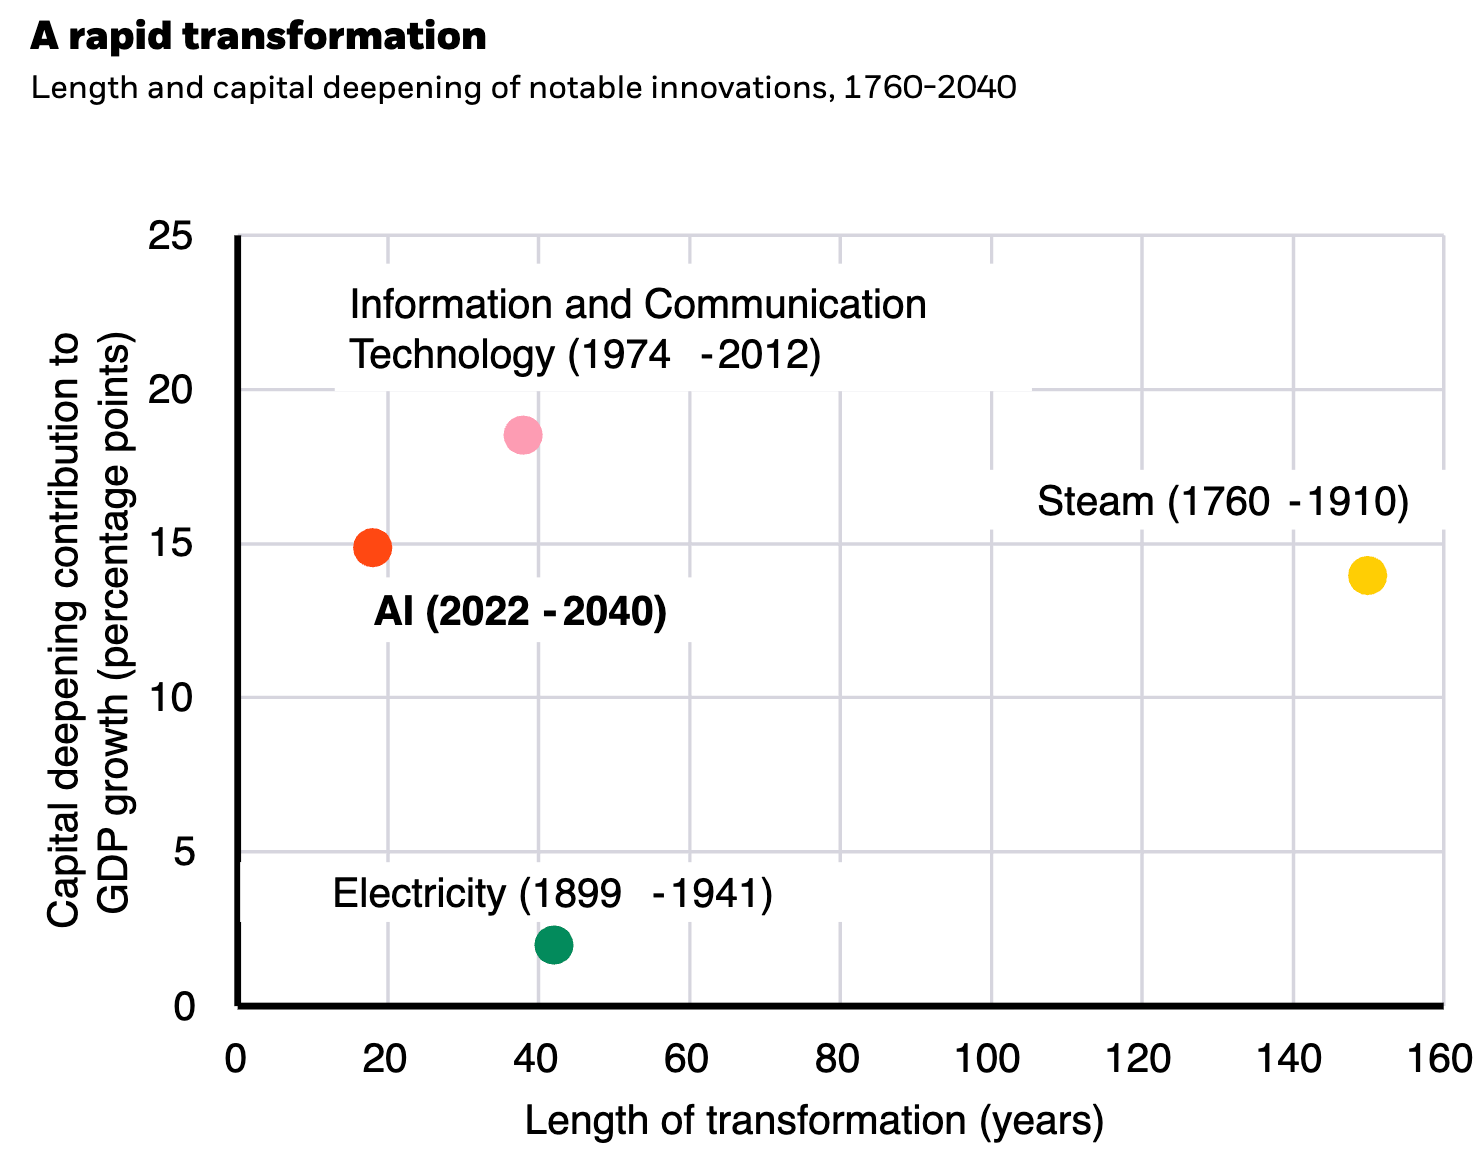
These boom cycles tend to be sparked by a fundamental technological revolution. Then at some point, psychology gets a hold of market participants and hype drives capital towards less productive projects. We saw this in the 1990s when the telecom industry based investment on the belief that internet traffic was doubling every 90 days—true early in the cycle, but false by the time it was being used to justify projects.
The AI buildout is expected to become the largest privately funded capital project in history—bigger than Telecom, Pipelines, and Railroads. With trillions of capital on the line, and infrastructure underpinning another revolutionary technology, this will continue to be a trend to keep an eye on.
The high-yield credit markets
We didn’t expect the high-yield credit markets to play a prominent role across both the Dot Com Boom and Shale Revolution series.
We were surprised to learn that the dot com bubble burst in two separate waves. Before 9/11, the animal spirits fueling the dot com craze reversed in early 2000, crashing dot com stock prices. However the broader market and the real economy remained unscathed until late 2001 when economic weakness following the 9/11 terrorist attacks combined with a mountain of telecom debt to drive a much deeper, credit-driven bear market.
Tech & Telecom represented 35% of the high-yield market before the crash. For context, it was typically 10% prior to 1995 and has settled closer to 20% since the crash.
Similarly, during the height of the Shale Revolution, energy companies’ share of high-yield was 16%—much higher than its typical 12%.
Financing AI infrastructure will likely follow a similar pattern with some exceptions. The investment-grade nature of hyperscalers along with the relative magnitude of modern private capital markets means the high-yield credit market will likely absorb less of these capital needs. This will make it harder to track excesses in AI infrastructure.
The global monetary system
We studied the Nixon Shock to better understand what happens when the world restructures its economic operating system. The rise of China as a competing superpower to the United States suggests we may be going through another restructuring.
This is huge.
There are implications for defense, trade, and importantly for the dollar’s role as the world’s reserve currency.
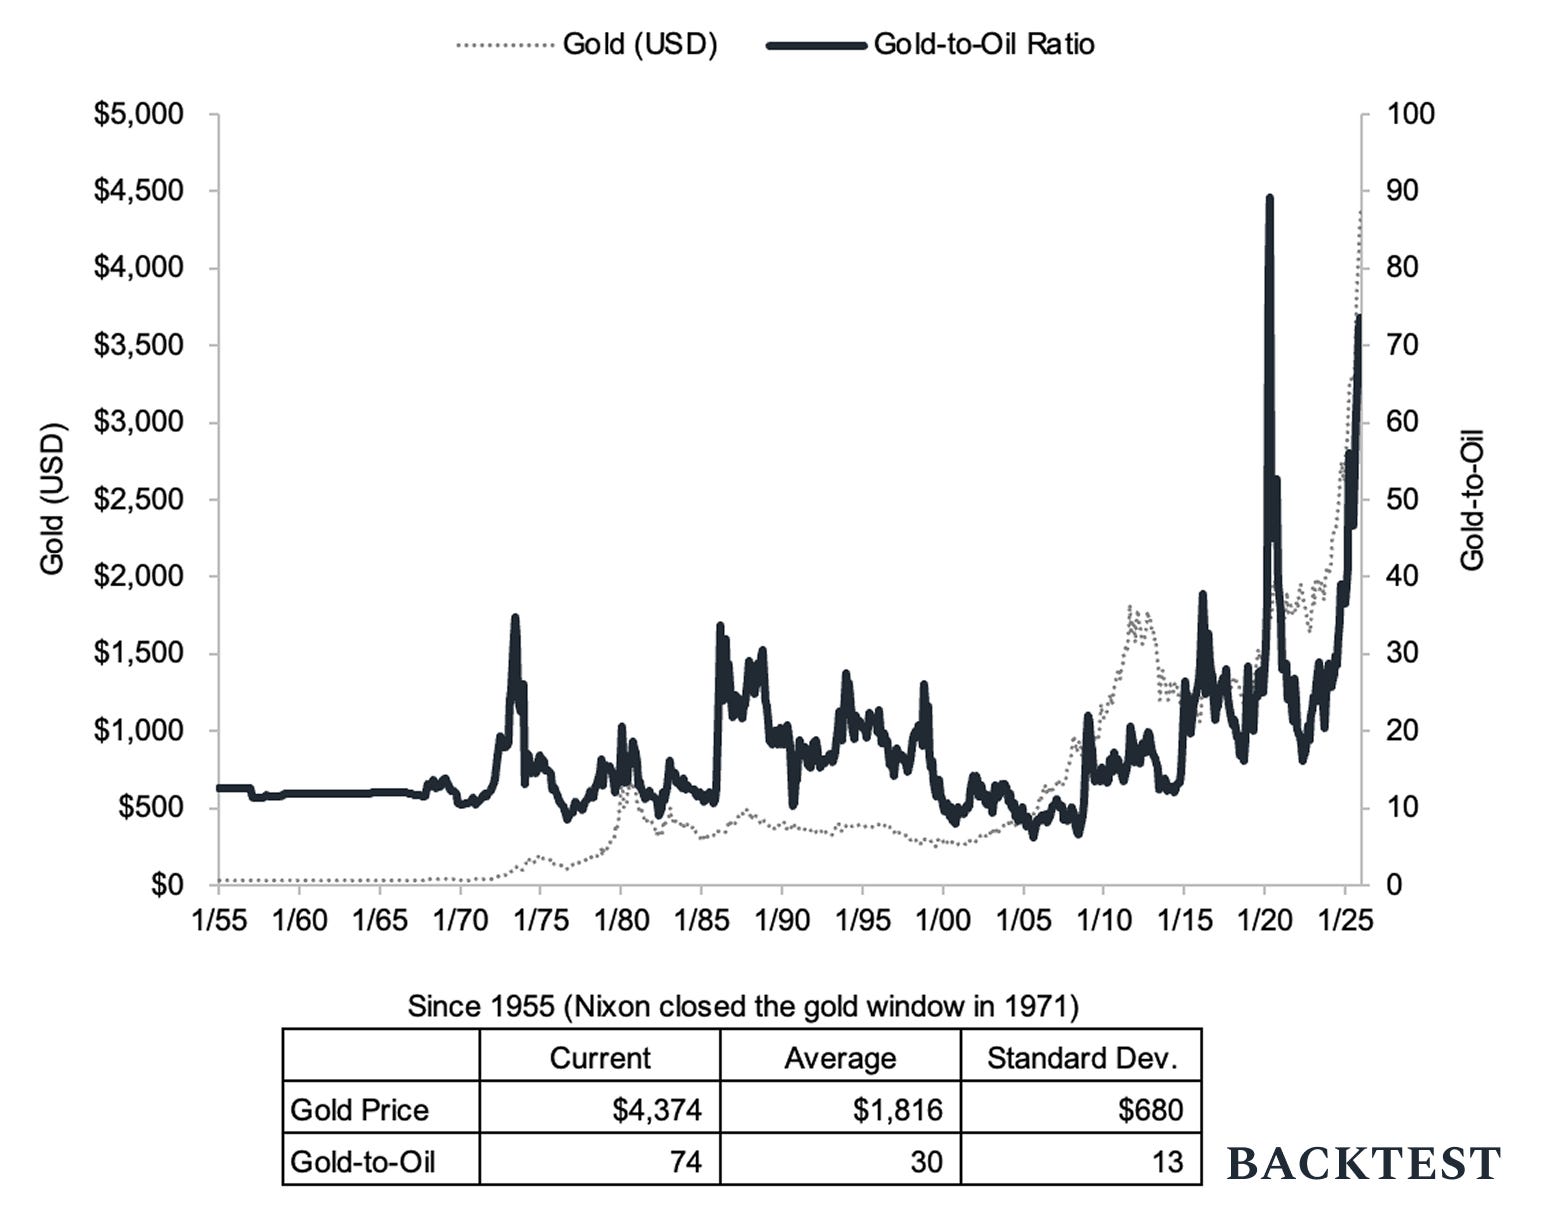
We learned in Part 3 of the Nixon Shock series that Treasury Secretary John Connally helped usher in the fiat era in 1971 by telling the world “it’s our currency but it’s your problem.” The world was much different then, but gold remains a key indicator.
The fact that central banks—most notably China—have been increasing the share of gold in their reserves, and that gold prices, particularly relative to oil, have been consistently rising for several years are powerful market signals.4
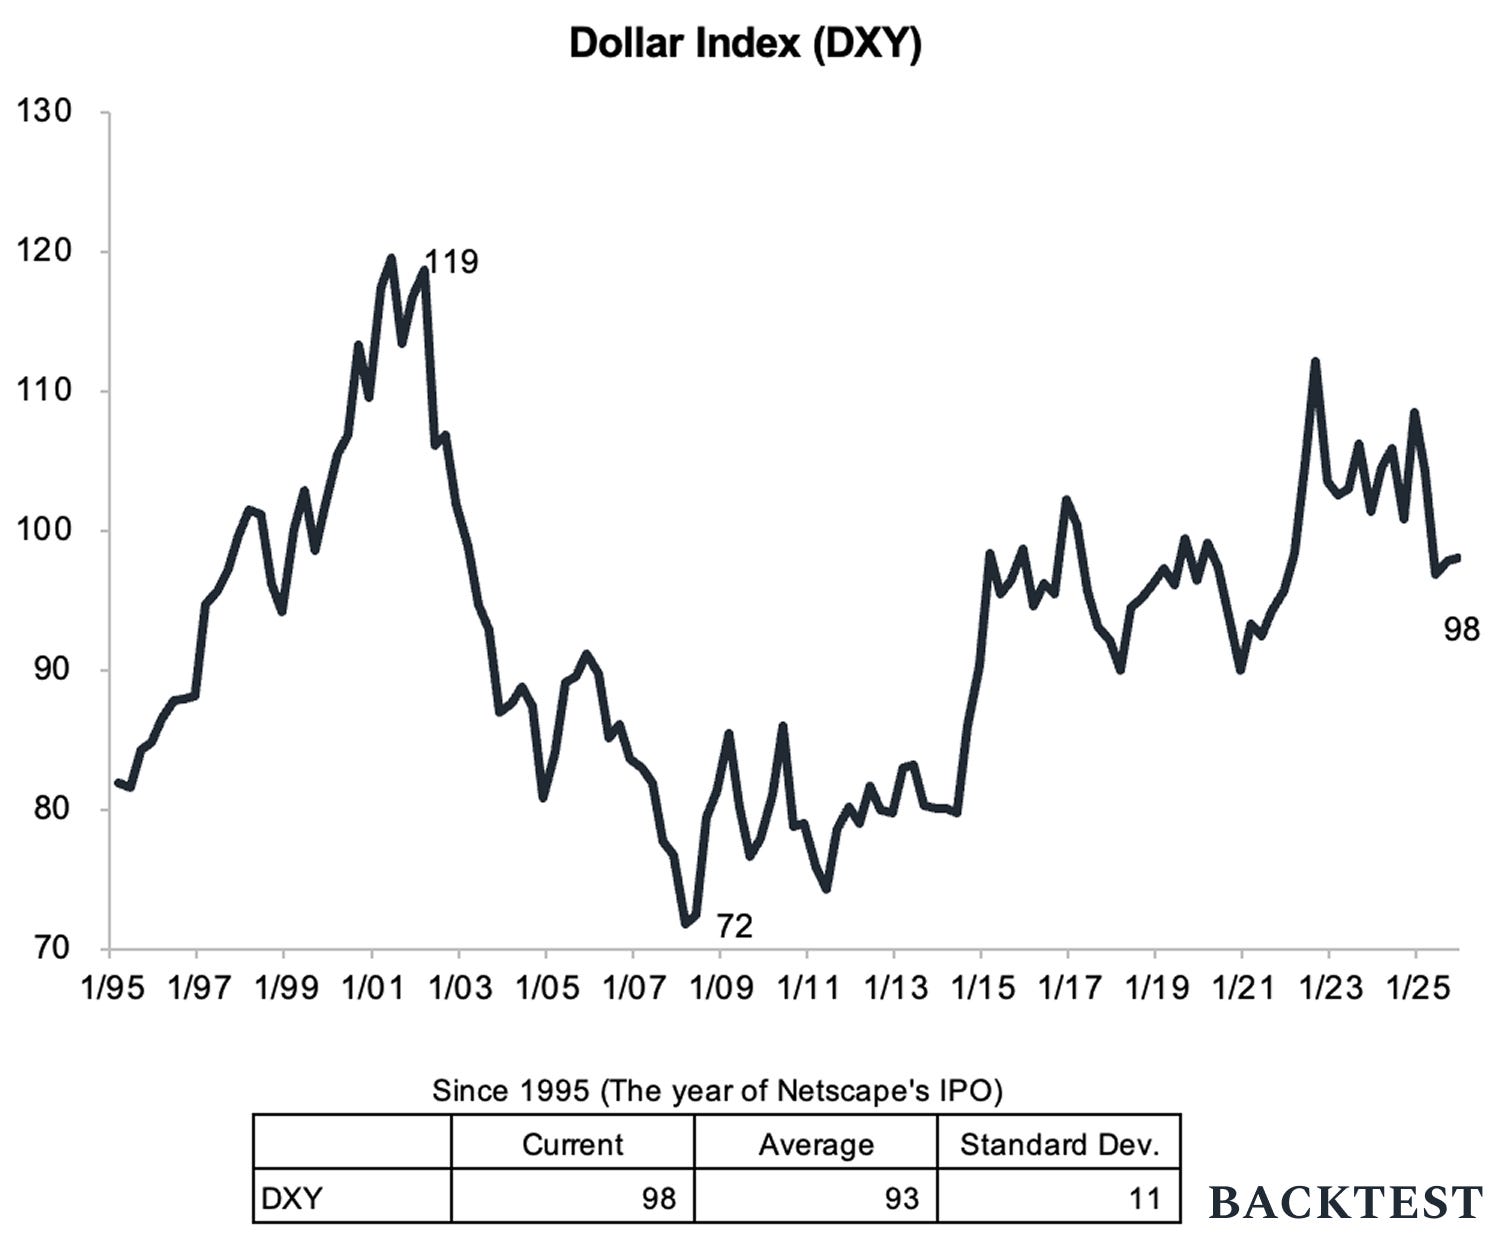
But the US dollar remains firmly within the historical range when compared to other major currencies. With a new Fed chairman taking over in May 2026, this dynamic is worth watching.
Looking ahead
“The reward for great work is more work… The reward for great work is not money, power, fame. It is the privilege to get to do more of this thing that I love doing.”
—Patrick O’Shaughnessy in conversation with David Senra | Dec 21, 2025
We’ll be adding two core features to Backtest in 2026.
A few of you have been pounding the table for these since we started. We preferred to take our time to get these right. We’re confident we did and we’re excited to announce them soon.
We are also deep in research mode for our next series—the first episode will drop at the end of January.
In the meantime, thank you for coming on this journey with us.
Stay tuned and please spread the word.
Special thanks to Emily Gamboa, Jenny Harris, Andrew Cronk, Andrew Gillick, Austin Hahn, Bob McNally, Dave Roberts, Guillaume Galuz, Haleigh Brown, Jared Garza, Kate Colvin, Michael Beschloss, Perry Williams, Sam Smith, Sarah Drommond, and Vinicius Alves. We’re also particularly grateful for the lessons shared by Ben Gilbert and David Rosenthal (Acquired), David Senra (Founders), and Patrick O’Shaughnessy (Invest like the Best, Colossus)—trailblazers whose footsteps have allowed us to move fast and avoid pitfalls. And finally, we couldn’t do this without the historians, writers, and analysts who organize the past so others can learn from it. We try to carry forward the torch they lit.
When bond yields are higher, stocks have to offer a better price to compete. A metric called the Shiller Excess CAPE Yield adjusts for that. It does this by adjusting the earnings of S&P 500 companies for the business cycle and for inflation to calculate a price-to-earnings ratio (PE), inverting it to calculate the implied earnings yield from the S&P 500, and subtracting the 10-year treasury yield. This captures how attractive stock prices are relative to risk-free bonds.
Compared to alternatives like equities or bonds, capital deployed to natural gas pipelines offered comparable high single-digit rates of return with minimal volatility (high-quality customers like cities and monopolistic businesses by nature), underpinned by durable assets, and with growth characteristics outpacing GDP growth.
The petrodollar system—established in the 1970s after the US abandoned the gold standard in 1971 (The Nixon Shock)—requires global oil trade to be settled in dollars. Oil exporters earn dollars, which they often recycle into US Treasuries creating structural demand for dollars. In other words, oil partially replaced gold’s role as the real asset underpinning the dollar’s value.